Synthetic airfoil scalar/vector field plus real NACA 0012 CGNS mesh from the URP research repository.
Scientific visualization / ParaView evidence
ParaView CFD Visualization Pack
Reproducible ParaView asset-production pack: scientific data ingestion, pipeline state, scripted rendering, camera animation, and QA rubric for AI visualization review.
Reviewer path: Start with the CFD visualization pack, open the ParaView state file,
compare the four rendered outputs, review the 20-second animation, then inspect the original CGNS airfoil mesh evidence.
4
rendered scientific views
1
20-second animation
2
ParaView-readable datasets
1
reproducible `.pvsm` state
Scope note
This project separates two goals: synthetic vector/scalar flow data is used to demonstrate ParaView visualization workflow control, while the included NACA 0012 CGNS mesh demonstrates native scientific data ingestion through ParaView's CGNS reader. No claim is made that the synthetic field is a validated CFD simulation.
Pipeline summary
Data to ParaView pipeline to reusable assets.
XML Image Data reader for `.vti` flow fields and `CGNSSeriesReader` for native `.cgns` mesh ingestion.
Slice, Clip, Stream Tracer, color mapping, scalar bars, camera state, and scripted screenshot export.
4 screenshots, 1 MP4 camera animation, 1 `.pvsm` state file, and 1 `pvpython` regeneration script.
All outputs regenerate from checked-in data and the public script/state files.
Real dataset ingestion
Native CGNS ingestion is first-class evidence.
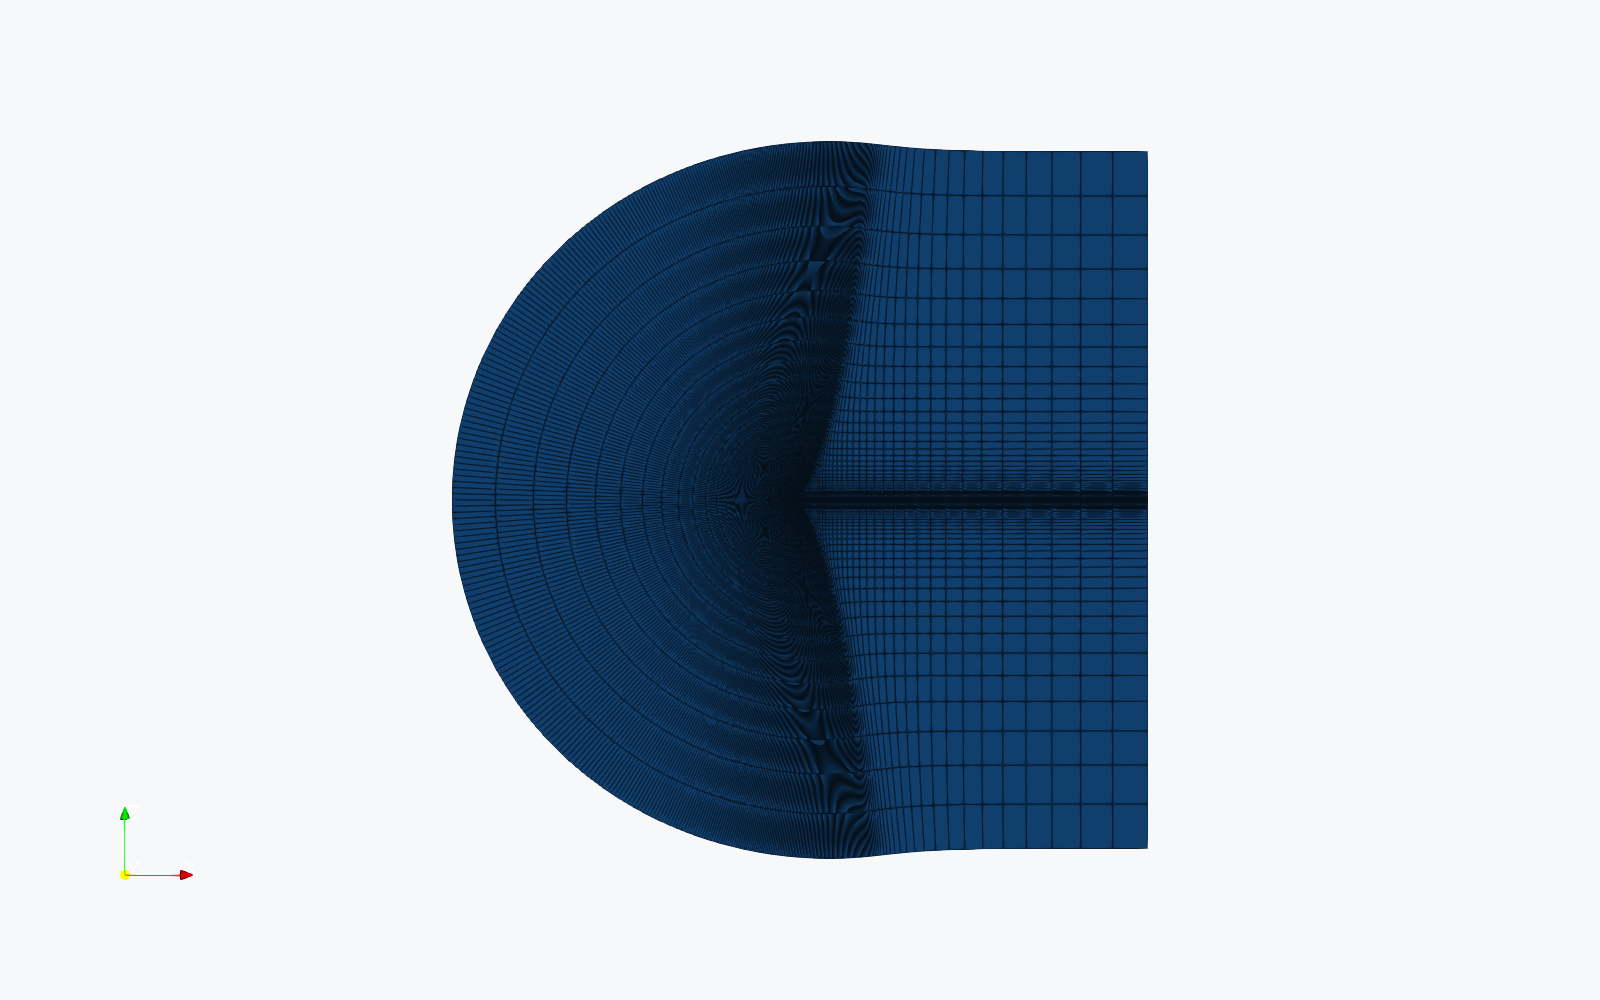
The original URP airfoil file is directly inspectable: ParaView opens `n0012_449-129.cgns` with `CGNSSeriesReader` and resolves it into a nested multiblock object containing a `vtkStructuredGrid`.
Flagship project
Airfoil CFD Scientific Visualization Portfolio
A focused ParaView evidence pack extending airfoil/CGNS visualization work and showing the work this role likely cares about: load scientific data, build a pipeline, export screenshots and animation, preserve state files, and explain what each visual means.
Required visualization outputs
Four inspectable ParaView views.
The screenshots are generated from the reproducible `pvpython` workflow and checked into the public URP repository.
 01
01
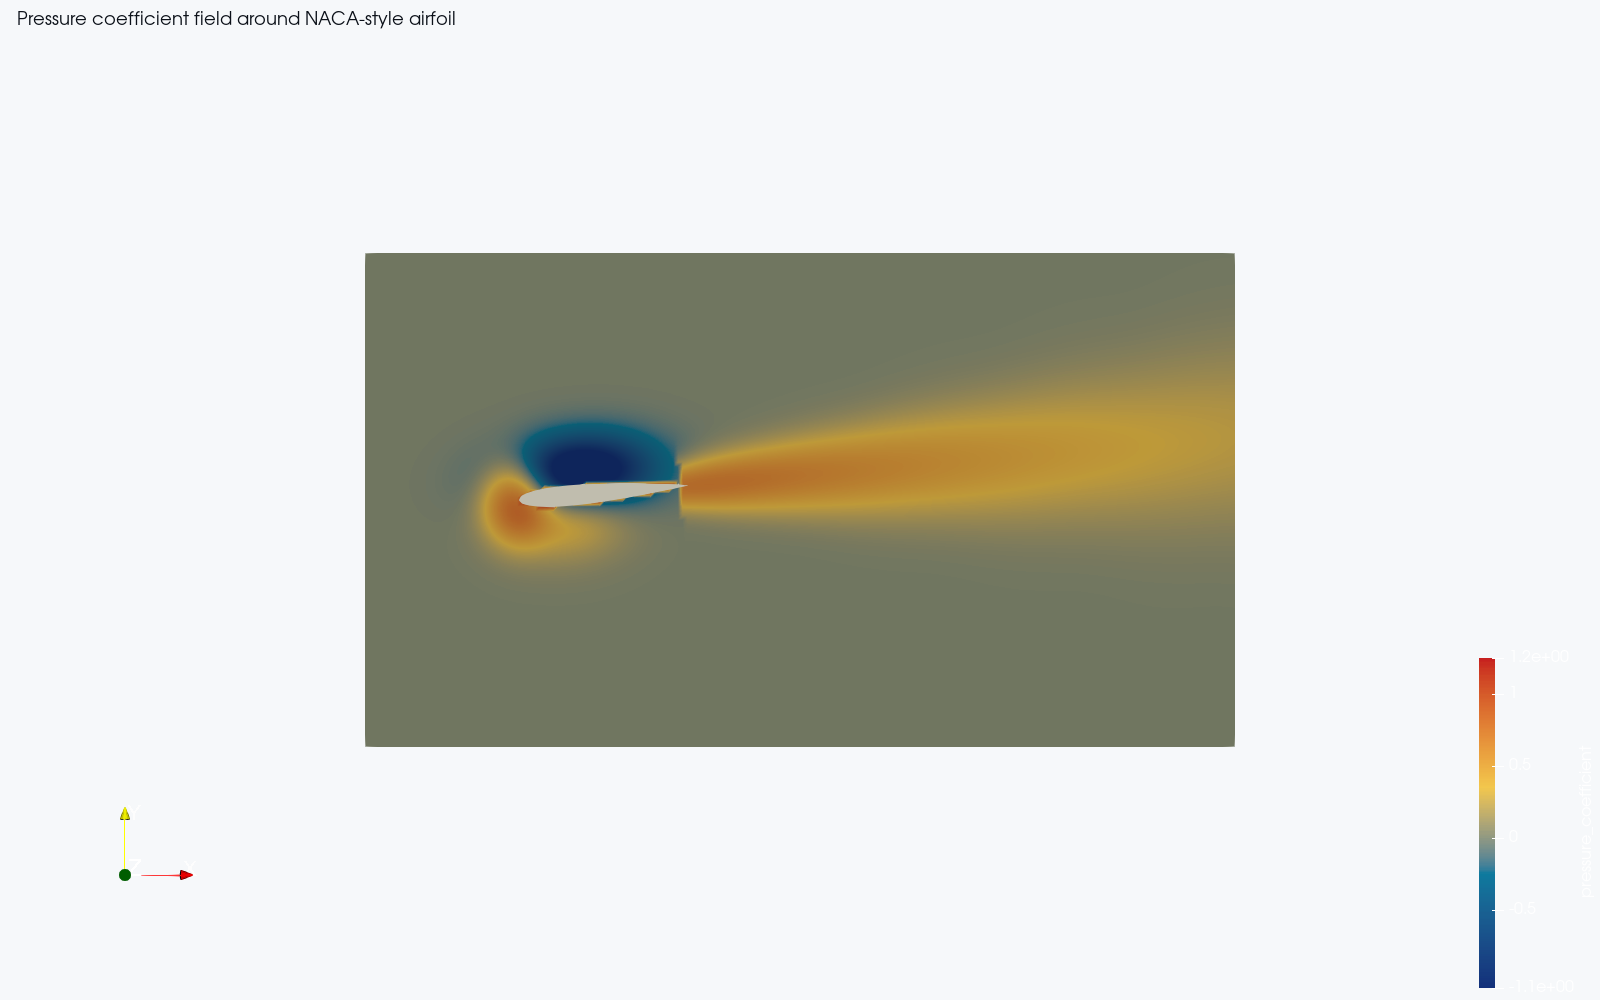
Pressure Field
Array: `pressure_coefficient`. Pipeline: VTI reader → Slice → Color Map → Scalar Bar → Save Screenshot.
Open output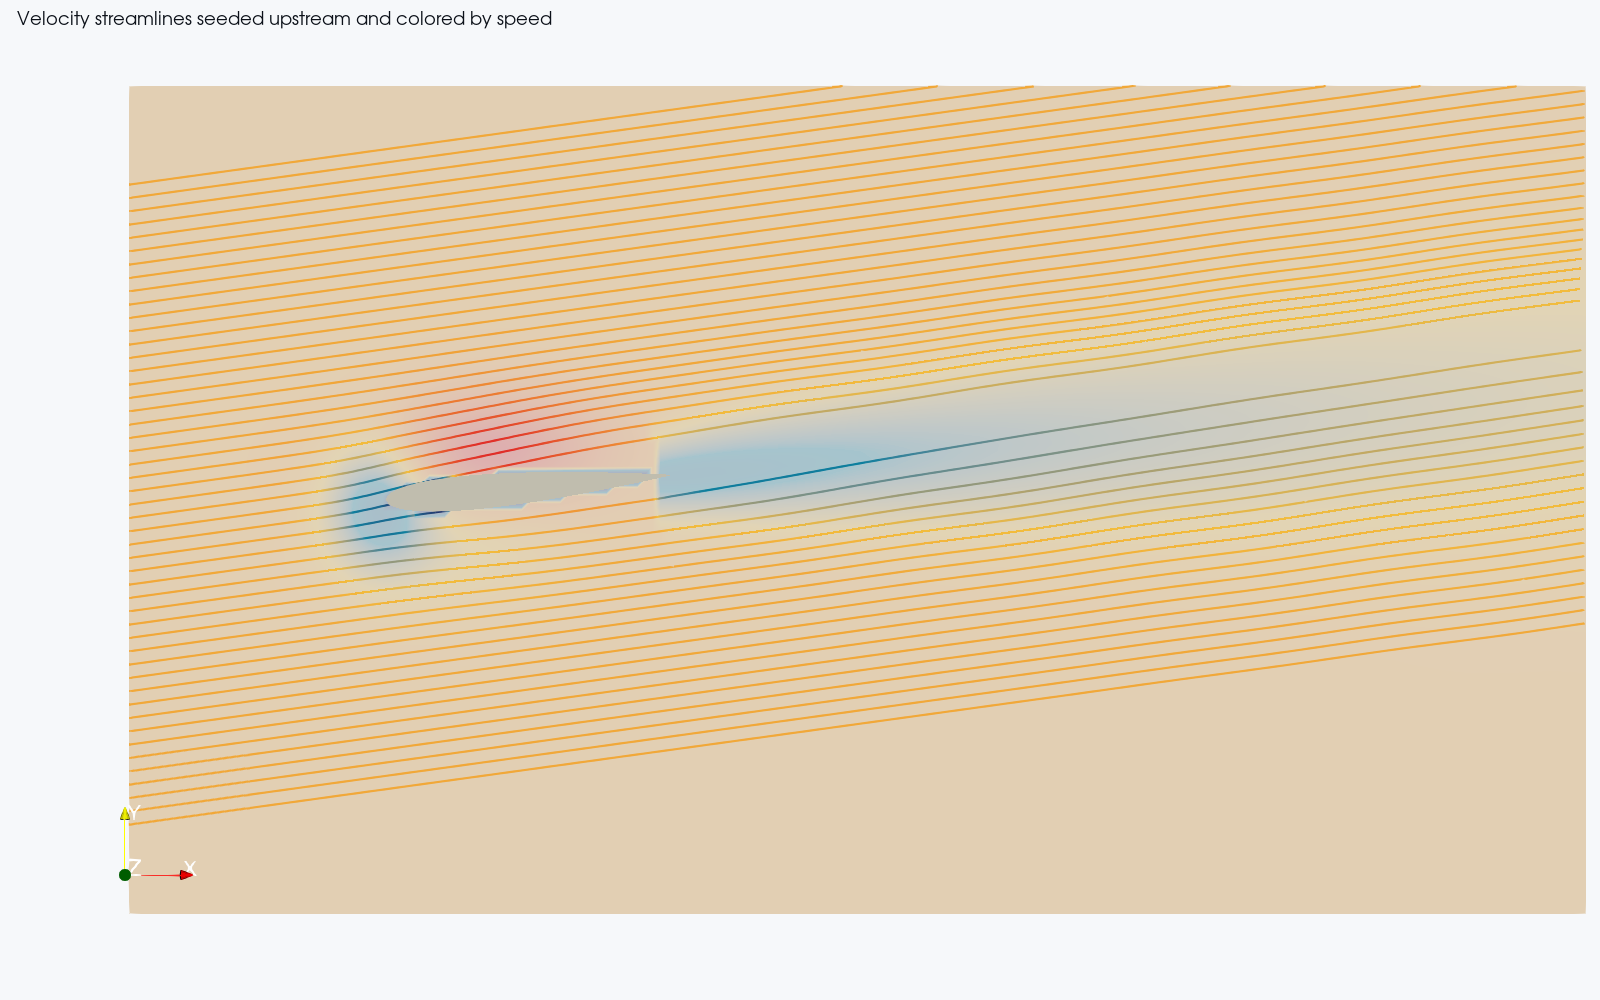 02
02
Velocity Streamlines
Arrays: `velocity`, `speed`. Pipeline: VTI reader → Stream Tracer → Line Seed → Color by speed.
Open output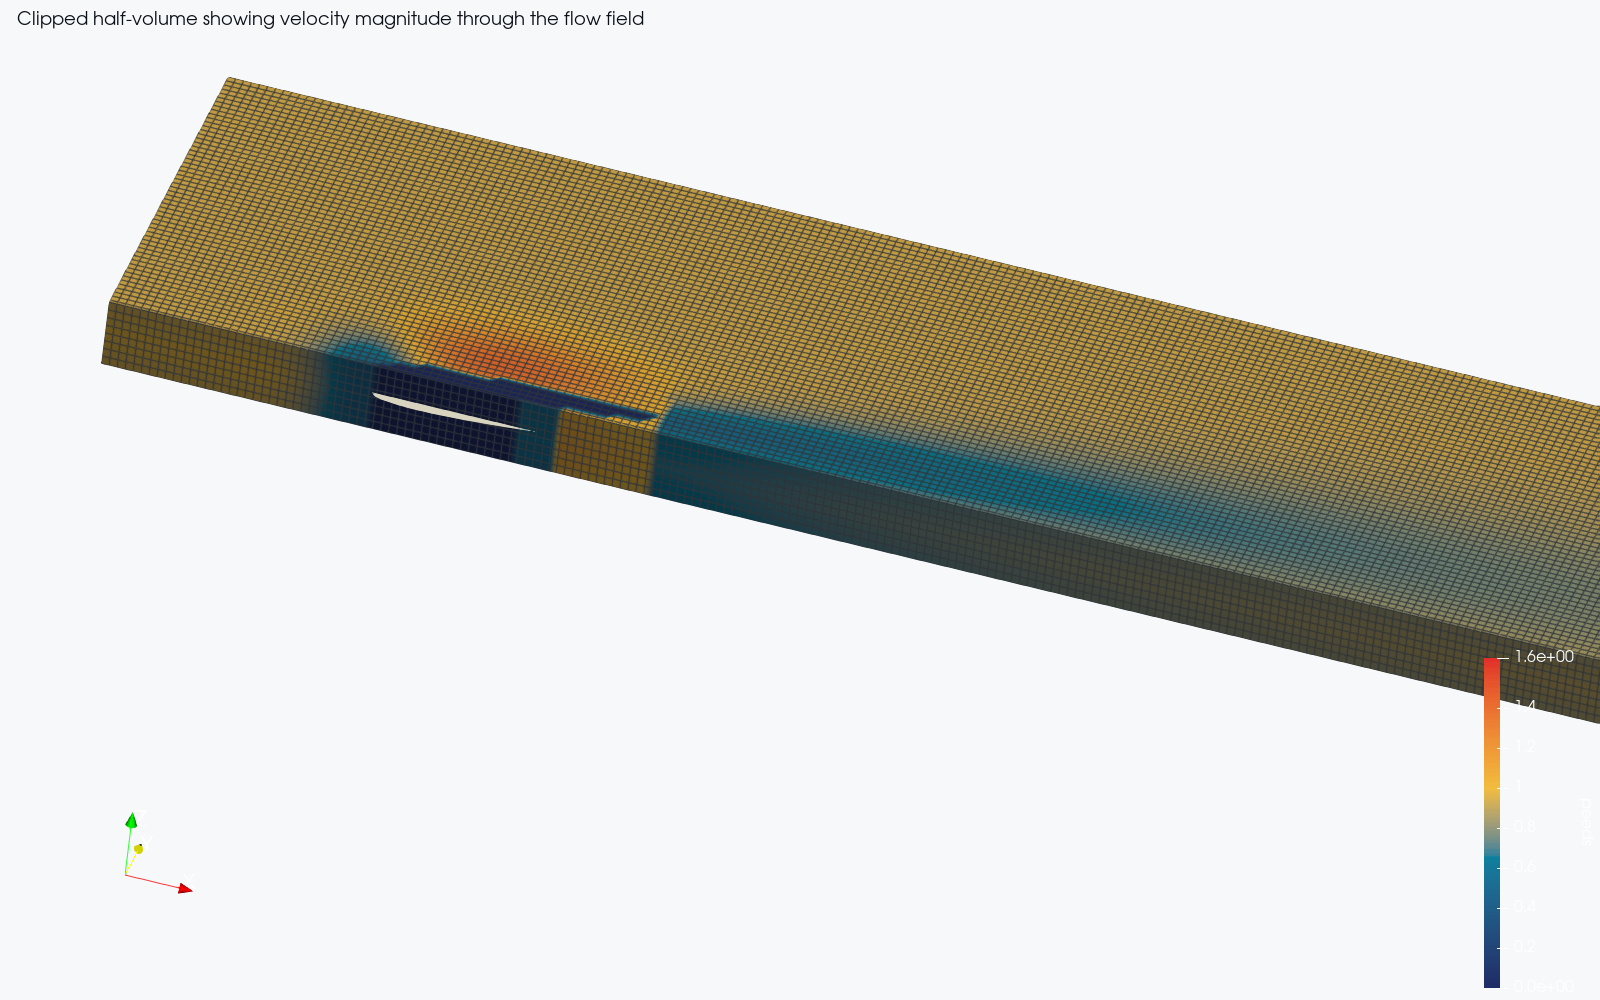 03
03
Slice / Clip View
Array: `speed`. Pipeline: VTI reader → Clip Plane → Surface With Edges → Camera State.
Open output
04
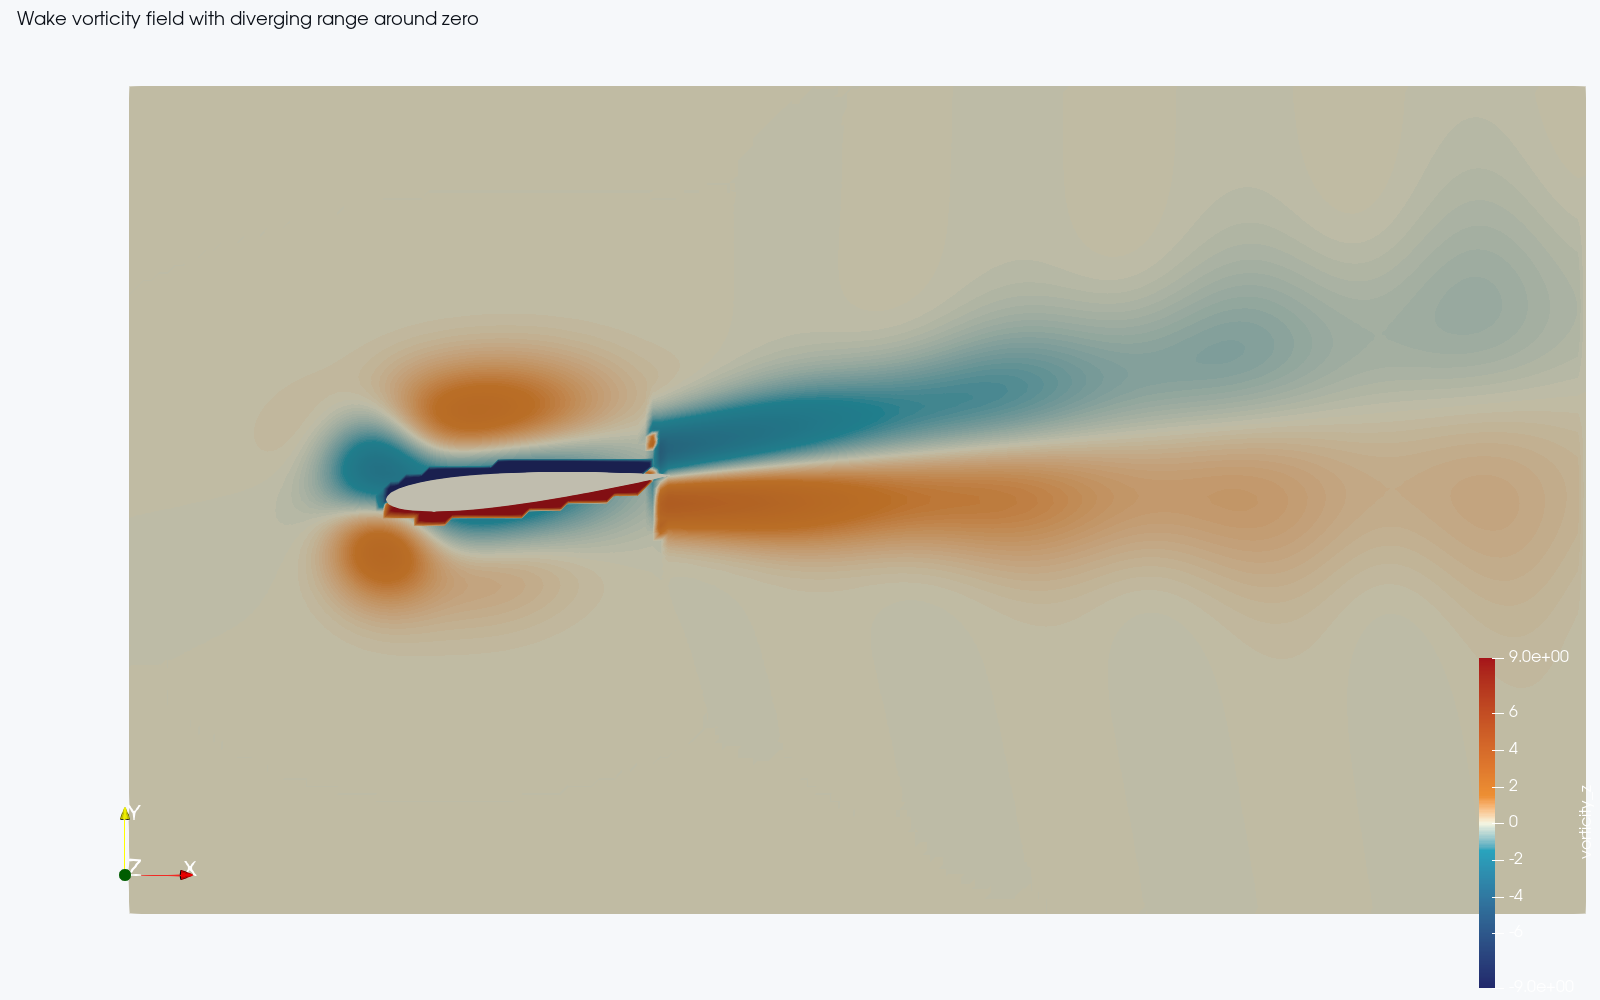
Wake Vorticity
Array: `vorticity_z`. Pipeline: VTI reader → Slice → Diverging scalar range → Airfoil body overlay.
Open outputPipeline state evidence
The pipeline is preserved, not just rendered.
The checked-in `.pvsm` keeps the reproducible ParaView graph. The evidence is the state file, regeneration script, and outputs that reload from repository data.
XMLImageDataReader1
  Slice1
  StreamTracer1
XMLPolyDataReader1
  Airfoil body overlay
RenderView
  pressure_coefficient
  speed
  vorticity_z
  camera + scalar bar state
Original URP evidence
NACA 0012 CGNS Airfoil Mesh
The original URP work with Dr. Shaowu Pan includes a checked-in `n0012_449-129.cgns` file. ParaView opens it with `CGNSSeriesReader` and resolves a nested multiblock object containing a `vtkStructuredGrid`.
AI visualization evaluation
Scientific Visualization QA Rubric
This section supports the AI research angle: how to evaluate generated ParaView assets before accepting them as useful scientific visualization training or review material.
Data and state files open in ParaView without fatal errors or missing source paths.
Scalar and vector arrays are named, documented, and matched to visual claims.
The rendered image shows the field it claims, with readable legends and bounded ranges.
Screenshots and animations regenerate from scripts or `.pvsm` files.
Captions explain arrays, filters, and interpretation without overselling the source data.
Synthetic datasets must be labeled synthetic, with no unsupported solver or validation claims.
Example evaluation: Pressure field view
Score: 8/10. Passes openability, array validity, visual claim alignment, and reproducibility. Needs reviewer awareness that the field is synthetic CFD-style data, not solver-validated output.
Evidence package
Evidence package for technical review.
Every artifact below is public and inspectable in the URP repository.
| Asset | Format | Purpose |
|---|---|---|
| CFD visualization pack | folder | Application-ready ParaView evidence package |
| Airfoil flow field | `.vti` | ParaView-readable vector/scalar flow data |
| Airfoil body geometry | `.vtp` | Independent airfoil body geometry for rendering |
| ParaView pipeline state | `.pvsm` | Reproducible pressure, streamline, slice, and vorticity pipeline |
| Generation script | `.py` | `pvpython` automation for data, screenshots, state, and MP4 |
| Camera animation | `.mp4` | 20-second four-scene ParaView walkthrough |
| Visualization decisions | `.md` | Interpretation, scope, and reviewer notes |
| Original CGNS dataset | `.cgns` | NACA 0012 CGNS airfoil mesh evidence |
| CGNS inspection log | `.txt` | Reader, VTK object tree, bounds, and array notes |
| AI sciviz rubric | `.md` | Criteria for reviewing generated visualization assets |
Portfolio link recommendation for the survey: submit this page or the URP pack folder directly. The strongest proof is the public `paraview-cfd-visualization-pack`, with original CGNS airfoil evidence as supporting context.